IQ TRADE Trading View Indicator
IQ TRADE Optimizer
A TradingView parameter-sweep indicator that ranks 20 parameter values in a single chart load — the companion to the IQ TRADE Strategy.
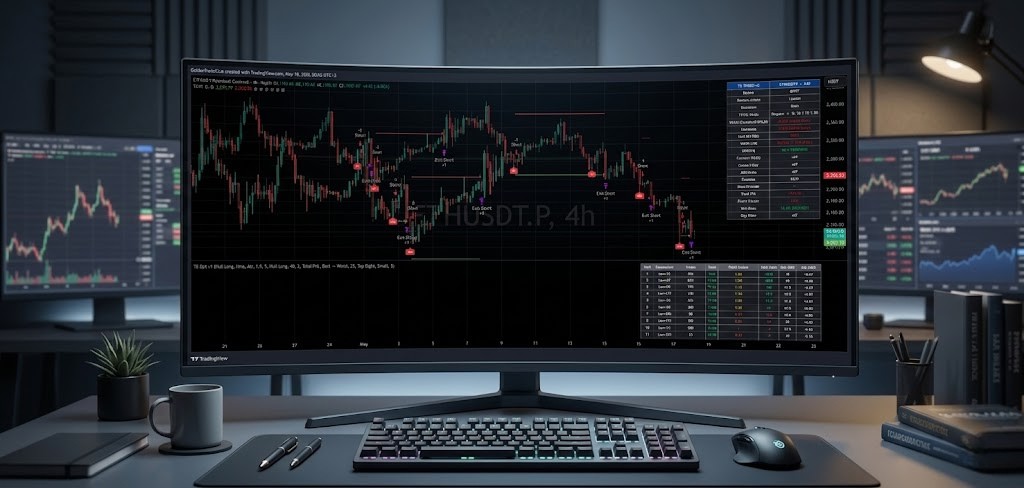
The IQ TRADE Optimizer is a Pine Script v6 indicator built to answer one question, fast: given the current chart and timeframe, which parameter values for a chosen entry trigger or TP/SL pair would have produced the strongest historical results? Instead of re-running the IQ TRADE Strategy by hand with twenty different Hull lengths or a hundred different stop and target combinations, the Optimizer simulates all of them in parallel in a single chart load and ranks them in a sortable results table.
The Optimizer is included with every IQ TRADE subscription, both the Crypto Trading Kit and the FX & Prop Firm Kit. It sits in its own pane below the price chart and works alongside the Strategy without interfering with it.
What it sweeps — 13 modes, one indicator
One dropdown switches between thirteen optimization modes. Each mode targets one family of parameters and ranks all variants:
- Six Hull modes — Long, Long Re-Entry, Long Reverse, and the three mirrored Short modes. Each sweeps 20 Hull MA lengths across a log-spaced range from 5 to 500. The Hull Variation input (Hma, Thma, Ehma) is shared so the sweep matches whatever variation you trade in the Strategy.
- Four VWAP modes — primary and re-entry, both directions. Sweeps 20 lookback lengths from 3 to 100.
- Two Trendline modes — long and short. A 5 × 4 grid: five pivot lengths (5, 12, 22, 35, 50) crossed with four slope multipliers (0.5, 2.0, 5.0, 10.0).
- One TP/SL Grid mode — a 10 × 10 grid of take-profit and stop-loss combinations applied on top of any base trigger you choose. TP runs from 0.40% to 5.00%, SL from 0.50% to 5.00%.
How the simulation works
Pine Script’s strategy() framework runs exactly one backtest with one parameter set per execution. To test twenty Hull lengths in parallel, the script would need to be twenty strategies at once — which Pine does not allow. The Optimizer sidesteps this by being an indicator that simulates virtual strategies in arrays. Each variant has its own in-trade flag, entry price, trade counter, win counter, gross profit, gross loss, equity, and max drawdown.
On every bar the script runs the same loop a real strategy would, against every active variant:
- For each variant currently in a position, it checks the bar’s high and low against that variant’s TP and SL levels. If both could fire on the same bar, the stop loss is assumed to fire first — a deliberate conservative choice that avoids over-counting wins.
- For each variant not currently in a position, it checks that variant’s signal series for the current bar. If the signal fires, the variant enters at the close of this bar.
- On the chart’s last bar, it sorts every variant by the chosen metric and renders the results table.
Why log-spaced parameter ranges
The Hull length sweep uses 20 values (5, 6, 8, 10, 13, 17, 21, 27, 35, 44, 56, 72, 92, 117, 149, 190, 242, 308, 392, 500) rather than every integer from 5 to 500. Pine has hard limits on the number of series a script can keep in memory and on per-bar execution time. Sweeping integer-by-integer would mean nearly 500 separate Hull series per mode — far past the compiler’s series cap. Log-spacing concentrates samples where small differences matter (at short lengths, where Hull-5 behaves very differently from Hull-13) and accepts coarser resolution at long lengths, where Hull-300 and Hull-301 are practically identical. Once the Optimizer narrows the winning region, you fine-tune by hand within that neighbourhood inside the Strategy.
Reading the results table
The table appears in the chart’s top-right corner and refreshes whenever you change a setting. Each row is one variant, with columns for rank, parameters tested, trade count, win %, profit factor, total P&L, max drawdown, and average P&L per trade. Win % and profit factor are colour-coded so the table is scannable at a glance.
What “good” looks like: a trade count well above the minimum threshold (ideally 30+ for short timeframes, 20+ for swing), profit factor at or above 1.3, a positive total P&L over a window long enough to include several market regimes, and a max drawdown materially smaller than the total P&L. Variants with too few trades are greyed out — statistically thin, treat them as noise.
The Optimizer–Strategy workflow
The Optimizer is half of the cycle; the IQ TRADE Strategy is the other half. The intended workflow is: use the Optimizer to narrow the search, plug the winner into the Strategy, then verify with your full filter stack — ADX gate, sessions, Smart Filter, MACD Confirmation — before committing real capital. The Strategy’s backtest numbers will not exactly match the Optimizer’s, and this is by design: the Strategy enters at next-bar open while the Optimizer enters at signal-bar close, the Strategy’s filters narrow the trade set, and the Strategy compounds equity while the Optimizer tracks flat per-trade P&L. What matters is the relative improvement, not the absolute numbers.
Honest expectations
An optimizer ranks history. Markets change. A parameter that ranked first over the last 5,000 bars may rank tenth over the next 1,000. The Optimizer is a tool to narrow the search, not to declare a winner. Treat every top result as a hypothesis to validate — through out-of-sample testing, multi-timeframe checks, and live forward observation — not as a fact to act on.
The Optimizer deliberately does not apply the Strategy’s filters during its sweep — no ADX, no sessions, no day-of-week. The point is to see how a raw signal performs before filters narrow it. It does not replace the TradingView Strategy Tester; it points you at the right neighbourhood to test there.
Try IQ TRADE for 7 days, free
Every subscription includes both the IQ TRADE Strategy and the Optimizer. See plans at iqtrade.ai/home.
Risk disclaimer. Trading carries risk and is not suitable for everyone; you can lose money. IQ TRADE provides software tools and educational material, not financial, investment, or trading advice. Past or backtested performance is not indicative of future results. See our Terms of Use for the full risk disclosure.